Information Forestry, December 2009

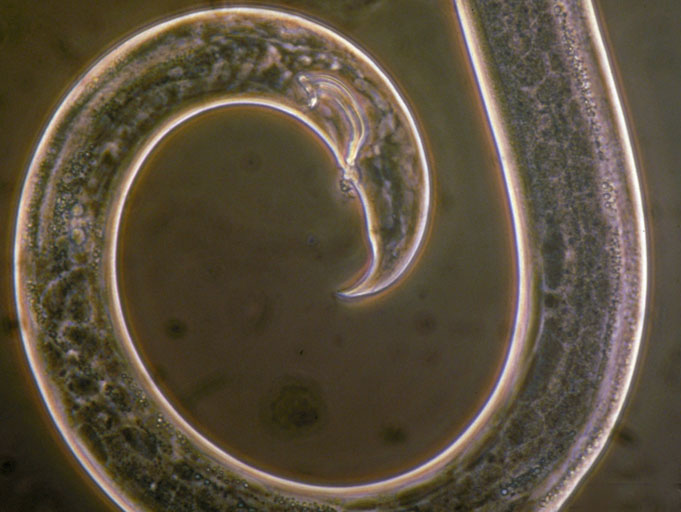
pinewood nematode, photo by L.D. Dwinell, USDA Forest Service

International sanctions by countries in Europe and Asia target the trade and transport of North American wood that may be infected with pinewood nematode, the cause of pine wilt disease.

A new molecular diagnostics method developed by Natural Resources Canada to detect live pinewood nematode in wood caught the attention of forest health officials from around the world.

“Scientists from countries with forests infested by pinewood nematode expressed a great deal of interest, as did those who are developing phytosanitary treatments,” says Canadian Forest Service Research Scientist Eric Allen, who presented the method’s preliminary results at the 2009 International Symposium on Pine Wilt Disease in Nanjing.

Pinewood nematode is the microscopic roundworm that causes pine wilt disease. Native to North America, pinewood nematode rarely, if ever, affects North American tree species. However, it has caused serious damage in Asia and Portugal prompting quarantine regulations by concerned countries. In 1993, Europe banned imports of untreated softwood commodities from North America, resulting in significant decreases in markets.

The new detection method, developed by Canadian Forest Service Molecular Biologist Isabel Leal and colleagues, allows forest health officials to analyse wood samples for messenger-RNA associated with pinewood nematode heat-shock proteins. Unlike DNA, which can survive in dead tissues for years, mRNA degrades after an organism dies. Its absence indicates lack of viable nematodes in a sample.

“It’s important to have a method to differentiate between deal and live nematodes, because only live nematodes are a risk to forest health,” says Leal.

Many major wood-importing countries, including China, Korea and Europe, require all softwood commodities exported from countries where pinewood nematode is found be treated prior to export with heat according to international standards. Leal and colleagues’ method will allow plant health officials to test and verify the effectiveness of treatments against the damaging nematode.

The method will also protect trade, by allowing exporters to demonstrate that their softwood lumber, chips, logs, prefabricated housing and wood packaging is free of living nematodes.

© Natural Resources Canada 2009

orca off southern Vancouver Island, by Thomas Forster

Canadian Geographic, July 2009

A black Labrador retriever named Tucker is helping researchers determine why orcas summering off southern Vancouver Island are dying.

Tucker lends his nose to science by standing in a moving open-decked motorboat and sniffing the wind to detect orca scat floating on the surface of the Strait of Georgia and Haro Strait. His human colleagues, including Sam Wasser, director of the University of Washington’s Centre for Conservation Biology, scoop of the greenish brown goo and later analyze its hormone levels.

“Killer whale scat doesn’t stay afloat long, and it’s about the same colour as the water,” says Wasser, who uses dogs to study elephants, caribou, spotted owls and other at-risk species. “Without a dog, we’d have a hard time getting enough samples.”

Because Tucker can smell the poop from a long way off, the researchers needn’t crowd the whales. Preliminary analysis of hormones in the scat suggests that boat traffic stresses orcas.

The results from samples collected since 2006 also indicate the whales’ preference for Chinook salmon may be causing them to starve. Stress hormones in the scat peak and thyroid hormones plummet from September through December, when the salmon are at their scarcest. Thyroid hormones help regulate metabolism. When an animal starves, levels drop and metabolism slows. Wasser says the hormone levels mirror observed orca death rates.

“In 2007, thyroid levels in the samples were highest, and no whales died. They were intermediate in 2006, when there was five percent mortality, and lowest in 2008, when mortality decreased to eight percent.”

More samples are needed to confirm the results. Wasser and Tucker will return to the straits to patrol for poop this summer.

History Mystery: Serving Mallet quiz

From 2004–2010, I edited the Maritime Museum of B.C.’s member newsletter, Waterlines, and annual journal, Resolution. B.C. Magazine approached me at that time to submit a piece about any strange and unlikely artifact from the museum’s collection for the magazine’s History Mystery quiz column.

History Mystery solved: Serving Mallet quiz

Information Forestry, August 2008—Orbiting the Earth more than 700 kilometres above Canada’s forests, a set of satellite-borne sensors collects data from the light reflecting off the planet’s surface.

Beneath the canopy of an eastern Ontario woodland, a Blackburnian Warbler prepares to fly south for the winter.

Linking these two phenomena is Biodiversity Monitoring from Space, or BioSpace, a Natural Resources Canada-led project that uses satellite-derived data to track key indicators of biological diversity over time.

BioSpace is the first system of its kind in Canada to use Earth observation data to monitor biodiversity over large areas in a systematic and repeatable manner. Its developers hope it will come to serve as an early warning system to alert governments and resource managers to critical habitat losses and areas with potential species at risk in even the most remote, inaccessible regions of the country.

“Most of the current work used to characterize biodiversity in Canada is very detailed and locally specific, and usually involves someone going out into the field and inventorying specific species,” says project leader Mike Wulder, a research scientist with Natural Resources Canada. “With BioSpace, we’re exploring the big picture: can we use Earth observation data from space to characterize national trends in biodiversity and identify locations where changes in certain conditions may indicate changes in biodiversity?”

BioSpace monitors four key indicators of biodiversity on the landscape, at one-kilometre spatial resolution. Topography drives climate. Land cover indicates types of cover (both vegetated and non-vegetated) and their spatial arrangement. The dynamic habitat index incorporates measures of annual vegetation productivity or greenness, amount of snow cover in winter, and seasonal variation in landscape greenness (an indication of when food is available). The fourth indicator is disturbance of land cover over time.

The BioSpace team recently compared indicator-based predictions of biodiversity to field data collected for birds, such as the Blackburnian Warbler, by the Ontario Breeding Bird Survey and on butterflies in the northeastern U.S.

“Land cover and seasonality are the two remotely sensed indicators that explain most variations in species richness for these two groups,” says Nicholas Coops, University of British Columbia Associate Professor of Forest Resources Management, Canada Research Chair in Remote Sensing, and a member of the BioSpace team. “Birds and butterflies like edge environments: they might live in one habitat, breed in another, and feed in a third. If you’re interested in using BioSpace to monitor the status of bird populations, you would focus on these two indices.”

“It’s very expensive to go out and monitor every single species at risk,” says Natural Resources Canada Biodiversity Science Advisor Brenda McAfee. “We don’t have the resources to do that even in the regions that have roads and easy access, let alone in remote regions of the country that have no roads or transportation infrastructure.” BioSpace, she says, would permit her group to report on biodiversity on an ecosystem or landscape level anywhere in Canada. Agreements requiring reports on biodiversity include the Convention on Biological Diversity, the Montreal Protocol’s Criteria and Indicators of Sustainable Forest Management, the Canadian Biodiversity Strategy, and the National Forest Inventory.

In addition, information generated from BioSpace allows researchers and natural resource managers to prioritize field sampling. “BioSpace is not a substitute for field sampling,” says Wulder. “You have to have boots on the ground in order to actually inventory the species and conditions.” BioSpace may facilitate allocation of scarce resources for detailed field studies and species-at-risk conservation.

BioSpace is supported by the Government Related Initiatives Program (GRIP) of the Canadian Space Agency.

“The development of a Canadian dynamic habitat index using multi-temporal satellite estimates of canopy light absorbance” and “Development of a large area biodiversity monitoring system drive by remote sensing” can be ordered from the Canadian Forest Service online bookstore.

Captions:

From the Cover: ist2_3765025-blackburnian-warbler-with-insect: Fragmented forests and woodlands make for important bird and butterfly habitat, according to a recent comparison of indicator-based predictions of biodiversity to field data. credit: © Paul Tessier, istock 2007


© Natural Resources Canada


Information Forestry,  December 2007

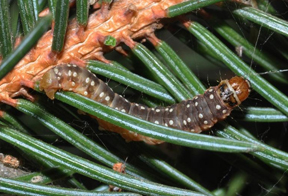
western spruce budworm, by William Ciesla, Forest Health Management International

Western spruce budworm’s prefers feeding on Douglas-fir needles.

A century-long ocean-warming trend may explain the rarity of western spruce budworm outbreaks on southern Vancouver Island since the 1930s, according to a study by Canadian Forest Service scientists Alan Thomson and Ross Benton.

Mild winter temperatures, linked to a rise in sea temperature, have de-synchronized budworm–host interactions in the region: budworm larvae now emerge earlier in the year, while timing of bud flush of Douglas-fir, the defoliator’s preferred host, remains unchanged. The trees do not respond to the early warming because their photoperiod requirements are already met by that time.

Race Rocks Lighthouse in distance. Photo by Evan Leeson

Scientists compared more than 80 years of sea-surface temperatures from Race Rocks Lighthouse (seen in distance) near the southern tip of Vancouver Island with historic air temperatures.

More than eight decades of sea-surface temperatures, collected at the Race Rocks Lighthouse near the southern tip of Vancouver Island, were compared with corresponding historic Environment Canada air temperatures. Mean sea surface temperatures and the mean maximum and minimum air temperatures from January to March correlated, with all temperatures from this region increasing over the period studied.

The good news does not extend beyond the south island, however: changing climate is believed to be contributing to a widespread, 30-year budworm infestation in the interior, far from the influence of sea-surface temperatures.

© Natural Resources Canada 2007

Information Forestry, December 2007 — Canada’s climate is changing, and forest pests are on the move.

In order to track and predict long-term effects of a warming climate on pests, Natural Resources Canada scientists use a software tool originally developed to help forest managers plan short-term pest control or sampling activities.

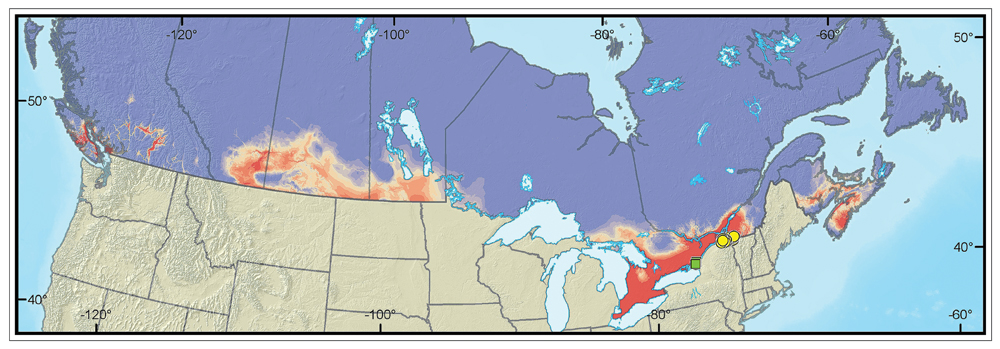
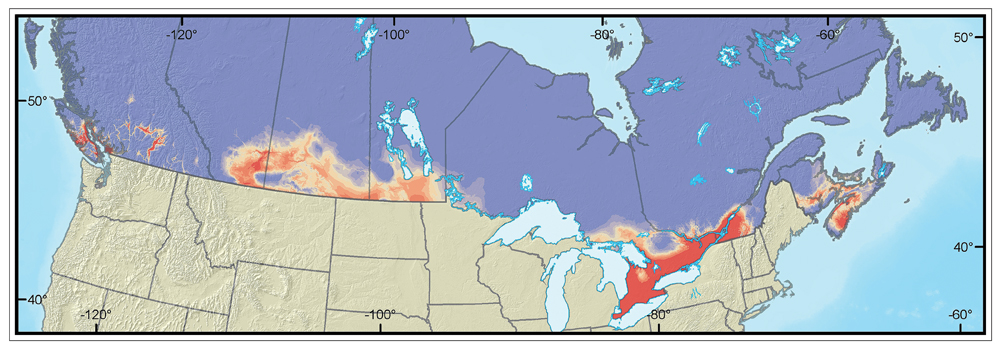
Distribution of gypsy moth in Canada from 1964 to 1970. Image © Natural Resources Canada


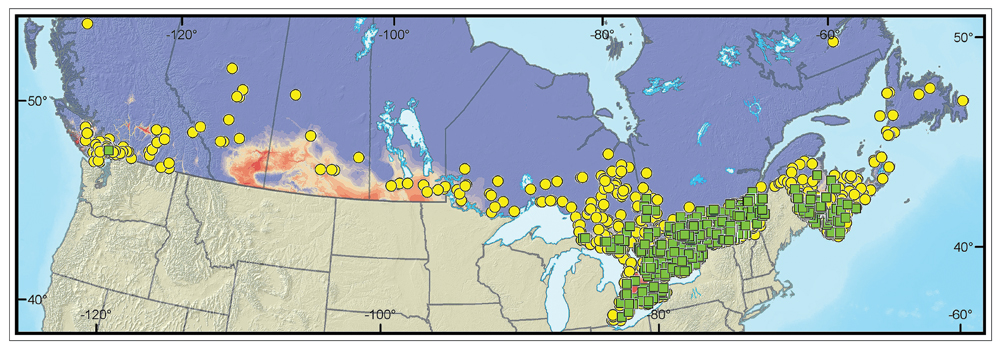
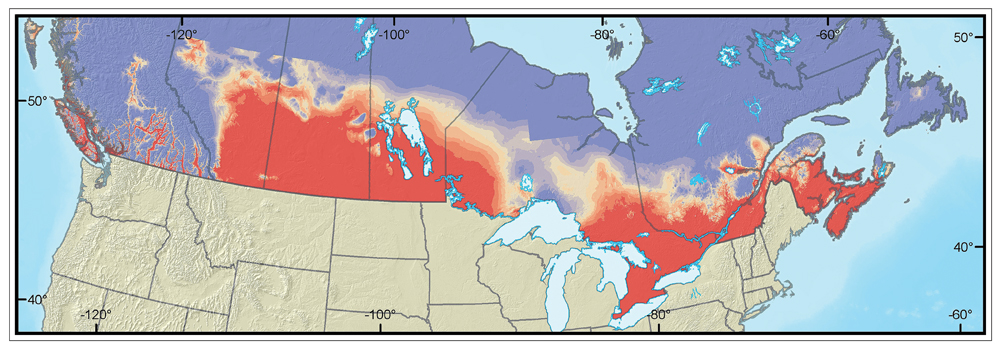
Distribution of gypsy moth in Canada from 2001 to 2006. Image © Natural Resources Canada

This tool, called BioSIM, links insect life-cycle models to weather data and manages their output to determine the timing of specific stages in an insect’s life cycle—for instance, when an insect reaches the stage most vulnerable to pesticide applications. BioSIM has recently been extended to help in forecasting where current or future climates might favour invasion by an alien species because the weather is, or will be, more suitable for its survival.

“The success of forest pest control programs hinges on the vulnerability of pest populations at the moment of intervention,” says Canadian Forest Service scientist Jacques Régnière, who studies insect population dynamics and developed BioSIM. “With insects, weather conditions are a controlling factor.”

In order to predict long-term climate effects on insect populations, the researchers use data from climate scenarios generated by the Canadian Global Circulation Model that extend many decades into the future.

“Taking BioSIM from immediate applications to seasonality modeling and establishing probability over long time periods was a bit of a leap in complexity, but not much of a change in paradigm,” says Régnière. “Whether you’re looking for short-term or long-term views, it uses the same technology: weather-data management and model-output synthesis.”

Régnière teamed up with fellow-Canadian Forest Service researchers Vince Nealis and Kevin Porter to determine probable range expansion of gypsy moth in Canada. At the Canadian Food Inspection Agency (CFIA)’s request, they analyzed historical records from Natural Resources Canada’s Forest Invasive Alien Species Database, and current and likely future range of gypsy moth in Canada, based on the Gypsy Moth Life Stage model, climate suitability and host distribution. Using the results, the researchers devised recommendations for gypsy moth management strategies, which they then submitted to the CFIA.

Potential distribution of gypsy moth in Canada, #1. Image © Natural Resources Canada


Potential distribution of gypsy moth in Canada, #2. Image © Natural Resources Canada

“The real benefits of models like BioSIM from a quarantine management point of view,” says CFIA Forestry Specialist Shane Sela, “are that they allow us to better assess risks, and more effectively allocate resources to critical areas where potential risk is highest.”

Régnière also worked with Insect Ecologist Allan Carroll to predict range expansion of mountain pine beetle in western Canada. According to their results, eastward invasion by the beetle will continue if current climate trends persist.

BioSIM is capable of determining probability of future range for any species—insect, pathogen or plant—because it is designed to work with any model that encompasses an organism’s life history and response to climate. This emphasizes the need to quickly acquire such information for any species that represents a significant risk to Canada’s forests.

© Natural Resources Canada 2007

book-ornithomimus-by-monique-keiran

Sample pages from Ornithomimus: Pursuing the Bird-Mimic Dinosaur, by Monique Keiran. Published by the Royal Tyrrell Museum of Palaeontology and Raincoast Books, 2002.

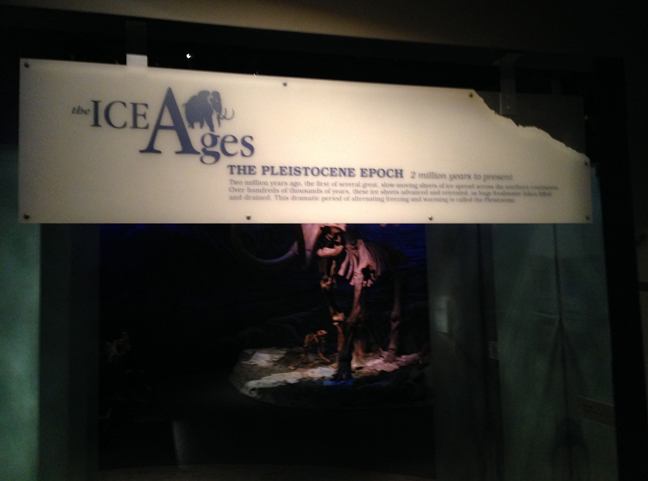
The Ice Ages Gallery

The Pleistocene Epoch
2 million years to present, at the Royal Tyrrell Museum of Palaeontology, Drumheller, Alberta

The Royal Tyrrell Museum opened the Ice Ages Gallery in 1999. A collaboration between curators, technical staff, the exhibits team and others, it tells the story of Alberta from two million years ago to the present—the time called the Pleistocene, when huge mammals roamed, great ice sheets came and went, and humans first arrived in North America.

I prepared the text for the panels and labels. Browse through the image gallery below for a view of gallery displays and signage. To read the signage, click on the image.